

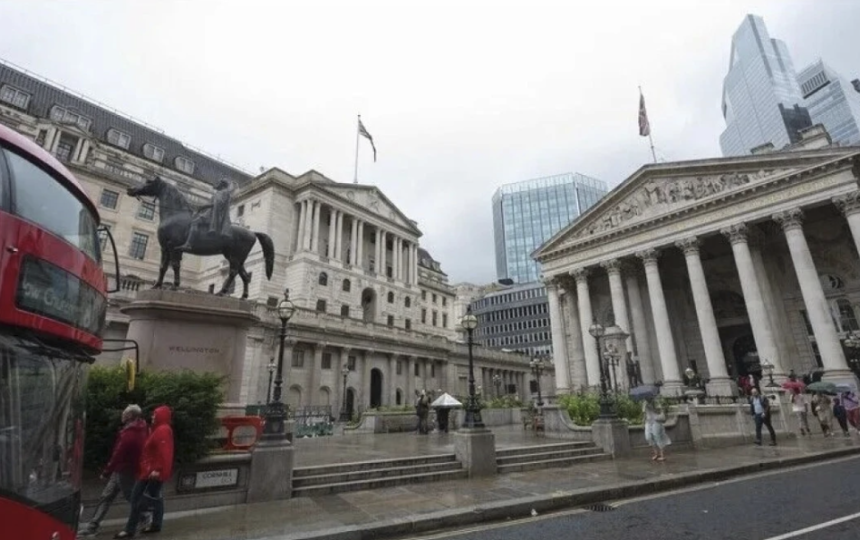
Economists had pencilled in a small fall for the UK economy in August, so a modest gain came as a pleasant surprise. The Office for National Statistics reported on 15 October that output rose by 0.1 percent, with factories doing the heavy lifting while the much larger services sector went nowhere.
In this article we will discuss what the figures show, which parts of the economy moved, how revisions changed the earlier picture, what statisticians, economists and ministers said, and how to read monthly growth figures sensibly.
August’s figures in brief
Gross domestic product, the standard measure of the value of goods and services produced in the UK, rose by 0.1 percent in August, according to the Office for National Statistics (ONS) release published at 12:30 on 15 October 2026. Press Association reported that economists had expected a 0.1 percent fall, so the outcome was better than forecast by a small margin in either direction. The monthly figure followed growth of 0.4 percent in July.
The ONS also revised June, which is now put at 0.4 percent growth rather than the 0.3 percent first estimated. Looking across a longer stretch, the economy grew by 0.7 percent in the three months to August. XTB, quoted in the coverage, adds that the economy grew by 2.2 percent over the twelve months to August, though that comes from a single source and is worth checking against the ONS tables.
The headline in context
A rise of one tenth of a percentage point is small, and it sits comfortably inside the margin of error that applies to early estimates. What gives the number its interest is the contrast beneath it: production surged, services stood still and construction slipped. The economy is made up of these three broad groups, and the way they pulled in different directions in one month tells you more than the total does.
It also matters that this followed a strong July. After a month that rose by 0.4 percent, a pause or a small fall would not have been surprising. That the economy kept edging forward instead is the reason the figure was greeted as welcome news by some commentators, even as others pointed to the pressures ahead.
How and when the figures arrive
The ONS publishes a monthly GDP estimate roughly six weeks after the month it describes, so the August figures reached the public in mid-October. Each release also carries a quarterly view and detailed tables by industry. Because the timetable is fixed and announced in advance, markets, businesses and ministers all react to the same numbers at the same moment, and that is why a figure as small as 0.1 percent can still dominate the day’s financial news.
Production drives the rise

Production, which covers manufacturing, mining, energy and water supply, rose by 0.8 percent in August. The coverage describes that as the fastest growth in the sector for nine months. It is a relatively small slice of the economy, but because it can move sharply from month to month, it often accounts for a large part of the headline change.
Manufacturing and pharmaceuticals
Within production, manufacturing grew by 1.2 percent. The coverage links part of that rise to pharmaceuticals, a sector where output can swing as production runs are scheduled and shipped. Individual industries like this are lumpy, so one strong month does not by itself prove a lasting change in direction.
A useful habit when reading industrial figures is to ask whether a rise comes from broad-based improvement or a single industry. Where a jump rests mainly on one sector, the usual outcome in later months is some give-back. Where many industries grow together, the improvement tends to be more durable. The August coverage points to a mix, with pharmaceuticals named as one contributor but not the only one.
What it means for jobs and orders
For workers, a stronger month in factories can mean steadier hours and overtime, though one month of output does not translate straight into hiring. Firms usually wait to see whether orders hold up before taking on staff or making large investment decisions. If you work in manufacturing, the best evidence about your own sector will come from your employer’s order book and from industry surveys, which tend to move before the official data.
Energy, mining and utilities
Production is wider than manufacturing alone, and the other parts of it, such as energy supply and water, tend to follow the weather and the season more than the business cycle. The coverage does not break out those components, so we cannot say how much they contributed. Readers who want the detail can find the industry tables in the ONS release, where each component of production is listed separately.
Services stall after two strong months

Services account for the bulk of the UK economy, so what they do matters most. In August the sector was flat, after what the ONS described as strong growth in the previous two months. A pause is not a collapse, and flat output after a good run can be seen as consolidation as much as weakness.
Where the weakness and strength showed
Within services, motor vehicle sales were strong. Bars and restaurants moved the other way, falling by 2.7 percent on the month. Hospitality figures can be volatile, as they respond quickly to the weather, to events and to household spending decisions. A fall of that size in one month is noticeable, but it is the trend over several months that tells you whether customers are cutting back.
The contrast between car sales and eating out is a reminder that households make choices when money feels tight. Spending on large, planned purchases may continue while discretionary day-to-day spending is trimmed. That is only a reading of one month’s pattern, and the data do not tell us why people spent as they did.
The services sector is also harder to measure than factory output. Counting cars made is straightforward, while measuring the volume of advice, hospitality, retail, health care and education involves surveys and estimates. That is one reason services figures are revised more often, and why a flat reading is best seen as a provisional estimate until the later data come in.
Hospitality deserves a closer look because it is one of the first places households trim spending. The reported 2.7 percent fall in bars and restaurants is large for one month, yet the same sector can bounce back just as quickly. For owners and staff, the practical lesson is that takings in this part of the economy can swing sharply, so keeping some financial slack matters more here than in steadier lines of work.
Why services matter more than they look
Because services employ most workers and generate most output, a stall there can offset a strong performance elsewhere. A 1.2 percent rise in manufacturing sounds big, but production is much smaller than services in size. Services barely moving can therefore swamp it, which is why the overall figure came out at only 0.1 percent. The ONS builds the total by weighting each sector by its share of the economy, and the weights explain much of the gap between the lively factory numbers and the modest headline.
Construction feels the weight of borrowing costs

Construction output fell by 0.2 percent in August. The coverage links the weakness to pressure from high mortgage rates, which hold back demand for new homes and make developers more cautious about starting projects. Construction is sensitive to the cost of money because both buyers and builders depend on credit, and a project that looked sensible when borrowing was cheaper may not stack up when it is dearer.
Why housebuilding responds so strongly
Housebuilding has long lead times, so a developer deciding whether to start a scheme is making a bet on prices and demand a year or more ahead. If buyers face higher monthly payments, the developer may build fewer homes or slow the pace of sales. The same logic applies to commercial property, where investors compare the returns on a project with what they could earn elsewhere.
For people thinking about buying a home, a quieter construction sector can mean fewer new properties coming to market, though the effect on prices and availability depends on many local factors. If you are saving a deposit, it is worth reading the lender’s published criteria and speaking to a mortgage adviser regulated by the Financial Conduct Authority, as affordability rules and available products can change.
The wider link to household budgets
Mortgage costs are also a reminder of how the economy and household budgets are linked. Money that goes on higher mortgage payments is not available to spend in shops, cafes and restaurants, which may be one factor behind soft consumer-facing sectors. We cannot prove that link from one month of data, but it is a plausible channel, and it is the kind of connection economists watch for in later releases.
Another reason to look past construction alone is that it can also be affected by the weather and by the timing of large projects. A dip of two tenths of a percent is small enough that it may be reversed next month, so the more useful signal is whether construction stays weak over several months. If it does, the link to mortgage costs would look stronger.
What to watch in the next release
The next monthly estimate will show whether production can hold its gains or hands some of them back, whether services resume growth, and whether construction stays soft. Those three questions are the natural follow-up to August, and the answers will be published by the ONS on its normal timetable. Until then, it is sensible to treat the latest month as one data point in a series, not as a verdict on the year.
Revisions and the three-month picture
Monthly GDP is an early estimate that gets revised as more data arrive. The June revision, from 0.3 to 0.4 percent, is a small example. The ONS builds its first estimate from the surveys and records available at the time, and later gathers fuller information from businesses and tax data. That is why the three month picture is generally treated as more reliable than a single month.
The table below pulls together the main figures from the release as reported. Items marked as single source come from one outlet and should be checked against the ONS publication.
| Measure | Figure reported | Note |
| GDP, August | up 0.1 percent | Economists had expected a 0.1 percent fall |
| GDP, July | up 0.4 percent | Strong month before August |
| GDP, June | up 0.4 percent | Revised up from 0.3 percent |
| GDP, three months to August | up 0.7 percent | Described by the ONS as further strength |
| GDP, twelve months to August | up 2.2 percent | Single source (XTB); check ONS tables |
| Production, August | up 0.8 percent | Fastest in nine months |
| Manufacturing, August | up 1.2 percent | Helped partly by pharmaceuticals |
| Services, August | flat | After strong growth in the previous two months |
| Bars and restaurants, August | down 2.7 percent | Fall on the month |
| Construction, August | down 0.2 percent | Pressure from high mortgage rates |
Why the three-month figure carries weight
The three-month growth rate smooths out the swings and gives a clearer view of the trend. A rise of 0.7 percent over three months suggests the economy has been moving forward at a decent pace through the summer, even if August itself was quiet. That is the context in which the ONS spoke of strength in the latest three months.
Why revisions are not a scandal
Revisions are a normal part of how national accounts work, and they can go either way. Anyone using the figures, from a business planning a budget to a student writing an essay, should quote the date of the release and keep in mind that numbers for recent months can change. The ONS publishes the latest estimates and revisions on its own website.
Reactions from statisticians, economists and ministers
Liz McKeown, the ONS director of economic statistics, said that GDP growth showed further strength in the latest three months, led by the services sector. That is a statement about the longer view, and it is consistent with the stall in August being a pause after a stronger period, not a reversal of it.
Yael Selfin of KPMG struck a more cautious note. As reported, she said households face renewed pressure from rising wholesale gas prices and higher long-term interest rates, and that these could weigh on activity in coming months. In other words, the August number is a snapshot of a month that has already passed, while the pressures she describes are about what lies ahead.
Ben Jones of the CBI said the economy has generally performed well so far this year, but that maintaining momentum looks difficult against a backdrop of rising inflation and tightening financial conditions. He is, in effect, making a similar point from the business side: the story to date is good, and the outlook is harder.
The Chancellor’s reading
Chancellor John Healey called the August figure welcome news. He said the figures offer more proof of Britain’s resilience in the face of global shocks, citing upgrades to the UK’s growth forecasts for 2026 from the International Monetary Fund (IMF) and the lowest deficit forecast in the G7 for 2029. Those are the Chancellor’s claims and should be read as such; the IMF’s own publications and the forecasts themselves are the place to check them. XTB’s coverage also notes that the IMF has upgraded its UK forecasts.
What the warning on gas prices means in practice
KPMG’s reference to rising wholesale gas prices is about the cost of energy for homes and firms. For households, the link to bills runs through the energy price cap set by the regulator, Ofgem, which is reviewed periodically, so wholesale movements show up in bills with a delay. For businesses, which are not covered by the household cap, costs can change more quickly depending on their contracts. Check the regulator’s website for the current position, because arrangements and prices change.
Why the mix of voices is useful
Each of these speakers has a different vantage point. A statistician is bound to describe the data neutrally, an economist at a professional services firm advises clients on risk, a business body represents employers, and a minister naturally emphasises the positives. Reading all four side by side, and noting who is making a claim and who is merely reporting one, is a good habit for any news about the economy. It also helps to check whether a claim can be verified from published data or rests on someone’s judgement of the future.
Reading the different views together
These reactions are not in conflict. The official statistician describes what has happened over a few months, the economists point to risks that could slow things, and the minister highlights the good news. A fair summary is that the economy has performed better than many expected this year, while the next few months face headwinds from energy costs, borrowing costs and prices. Which view proves right will show up in later releases.
Reading monthly GDP without over-reading it
GDP measures the total value of output in the economy. It does not measure how well off any one household is, how that output is shared out, or how people feel about their finances. An economy can grow while many households feel squeezed, above all if prices rise faster than pay, and it can shrink in a month without anyone noticing a change in their daily life.
Remember what the numbers adjust for
Headline GDP is quoted in volume terms, which strips out the effect of price changes, and it is seasonally adjusted so that predictable calendar patterns, such as the Christmas rush, do not distort the picture. Both adjustments are sensible, but they involve estimates, which is another reason the first reading is provisional.
Watch the size of the move
A change of 0.1 percent is within the range that statisticians treat with caution. When an economy is moving by tenths of a percentage point, the direction can easily flip with the next revision. It is wiser to treat a figure like this as consistent with a flat-to-slightly-rising economy than as a clear signal of acceleration.
Look at the mix
The sector breakdown is often more informative than the total. Here, the lift came from production, the stall from services and the dip from construction. Each of those points to different underlying stories: a lumpy industrial rebound, a pause after a strong run, and the pressure of dearer credit. When you read a headline, look for which sectors drove it.
Consider the total and the average person
Growth in total output is not the same as growth per person. Population changes affect how far the total goes. The ONS also publishes figures per head, and these give a different perspective on living standards. If you want to judge how the economy is doing for ordinary households, look at real pay, which compares wages with prices, alongside GDP.
Cross-check with other indicators
No single statistic tells the whole story, so analysts compare GDP with other evidence: business surveys, retail and hospitality data, employment figures and measures of consumer confidence. When several of these point the same way, confidence in the trend rises. When they disagree, as can happen when output is steady but surveys are gloomy, it is usually safest to wait for more data. For an ordinary reader, a good rule is to trust patterns that show up in at least two independent sources and treat one off moves with scepticism.
Keeping sources straight
When quoting these numbers yourself, say which figures come from the ONS release and which come from commentary, such as the twelve-month growth rate that appeared in a single outlet’s coverage. That small discipline avoids spreading errors and makes it easier for others to check your work.
A practical way to use the figures
For households, the main message from August is not to read much into a single month. The economy has grown over the summer, but conditions ahead look more testing, with the pressures named by economists. A sensible approach is to focus on what you can control, such as your budget, your borrowing and your savings buffer, instead of trying to second-guess monthly statistics.
If you are borrowing, remember that economic growth does not reduce your costs by itself. The cost of a mortgage or loan depends on the rate you can obtain, and that depends on market conditions and lender decisions. If you are within a few months of the end of a fixed deal, it is worth asking your lender or a regulated broker about options early.
If you run a business, the August pattern suggests that sector matters. Manufacturers saw a better month, while hospitality saw a dip. Use sector surveys, your own sales data and trade body reports to judge your own conditions instead of relying on the national total. Consider building in a cushion for energy and financing costs, which the economists quoted here identify as risks.
If you are an employee, the August figures are not a reason to change plans about pay or job moves on their own. Look instead at the labour market in your own field, at what comparable employers are offering and at whether your pay is keeping up with prices. If you are a saver or investor, remember that economic news is only one input to markets, and that short-term moves in response to a data release are often reversed. Spreading risk and keeping a long-term view generally serves ordinary savers better than reacting to single data points.
If you follow the economy for study, work or investment interest, make a habit of going to the source. The ONS publishes its GDP release, with detailed tables and notes, on its own website, and the Bank of England and the Office for Budget Responsibility publish forecasts. Treat early estimates as provisional, and check for revisions. Nothing in this article is personal financial advice; a regulated adviser can look at your own circumstances.
Frequently Asked Questions
How much did the UK economy grow in August 2026?
The ONS reported that GDP grew by 0.1 percent in August, after 0.4 percent in July. Economists had expected a fall of 0.1 percent. The figures were published on 15 October 2026.
Which sectors grew and which fell in August?
Production rose by 0.8 percent, with manufacturing up 1.2 percent, partly due to pharmaceuticals. Services were flat, and construction fell by 0.2 percent. Within services, bars and restaurants dropped by 2.7 percent while motor vehicle sales were strong.
Is the UK economy in a recession?
The reported figures show growth of 0.7 percent in the three months to August, so they do not point to a recession. A recession is usually defined as two consecutive quarters of falling output. Economists have warned about pressures ahead, so later releases will matter.
Why do GDP figures get revised?
Early estimates use the data available at the time, and fuller information arrives later. June growth, for example, was revised up from 0.3 to 0.4 percent. The ONS publishes the latest figures and notes on revisions on its website.
What did the Chancellor say about the August GDP figure?
John Healey called it welcome news and said it offers more proof of Britain’s resilience in the face of global shocks. He cited IMF upgrades to UK growth forecasts for 2026 and the lowest G7 deficit forecast for 2029. These are the Chancellor’s claims and can be checked against the IMF’s own publications.
Does higher GDP mean I will be better off?
Not automatically. GDP measures total output, not what happens to your own pay, prices or housing costs. Looking at real wages and your own budget gives a better picture of how you are doing.
